Our suite of analytical, decision support, and communication tools provide a conduit for relaying our scientists’ work to our membership, partners, and the public. These tools include story maps, more focused web mapping applications, and decision support tools. TU scientists developed the Steelhead Atlas and Eastern Brook Trout Conservation Atlas to gather the best map data on populations, habitats, and threats to these species, and deliver it to decision makers in an interactive, online format to allow for place-based evaluation of conservation risks and needs. The Delaware River Basin Pipeline Impacts tool allows anyone to assess the ecological impacts of major pipeline proposals in the Delaware River Basin. Our stream temperature monitoring resources include web maps tailored to monitoring needs in a variety of geographies. Story Maps are an innovative web-based platform presenting maps and multimedia in a narrative format to guide audiences through the issues that affect our fish populations, our water, and our fishing.
Story Maps
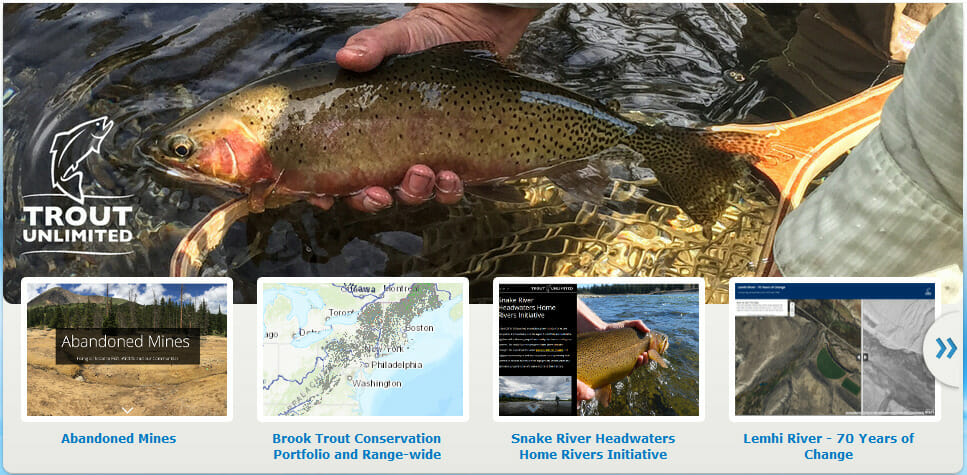
Story Maps allow us put our data, maps, photos, videos, and more into a portable, web-based storytelling platform. We like to think of them as self-guided multimedia presentations that can be shared on the web. Our members and partners can use Story Maps to explore the often complex scientific issues that drive our conservation work, or simply to learn about how a Trout Unlimited restoration project goes from identification of a problem to mobilization of our grassroots team of volunteers to cleaner water and better fishing.
TU mapping resources
TU has generated and compiled a collection of map data that are useful for exploring the location and pattern of key coldwater resources. These and links to other map information on public lands, hydrology, wildlife, and additional features can be found on TU’s Open Data GIS webpage.
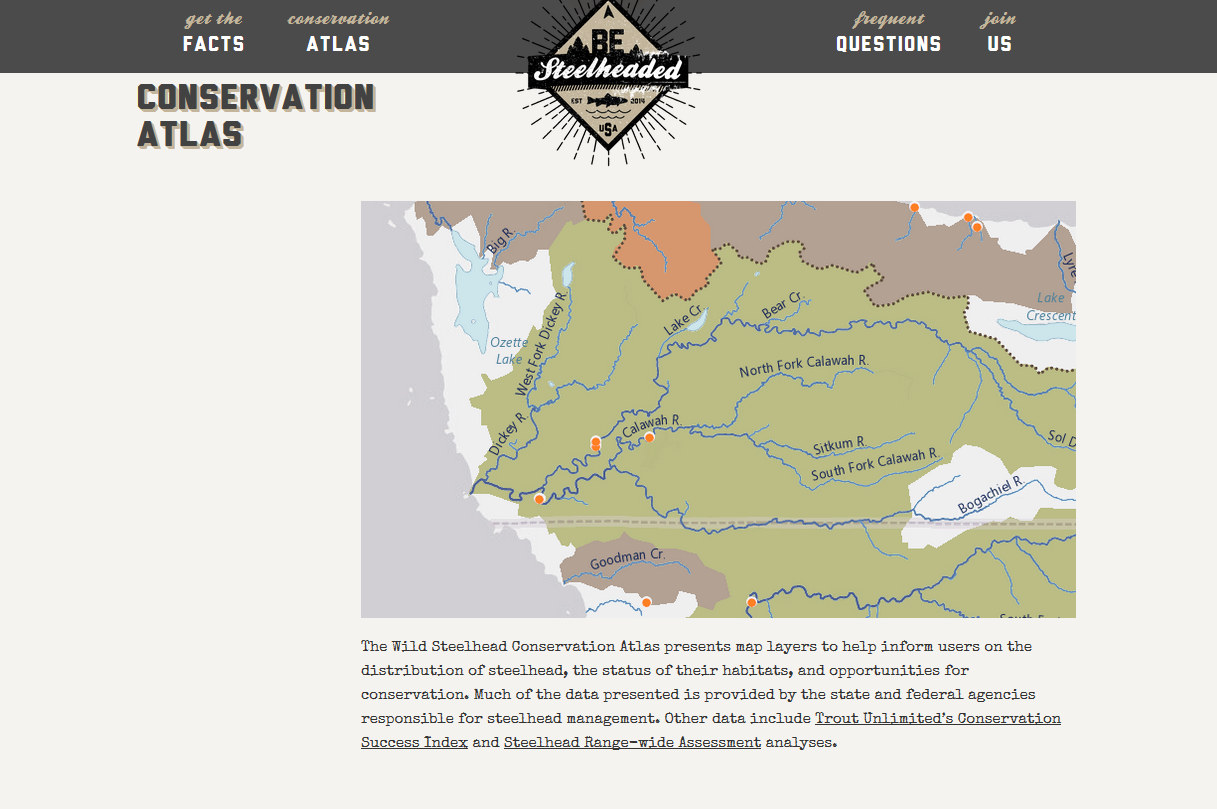
Steelhead Conservation Atlas
These maps provide a means to explore data related to steelhead distribution, populations, and habitats and can be used for exploring conservation opportunities or planning your next trip. Click on portions of the map to learn more about steelhead and conditions in your local watershed or elsewhere within the range of wild steelhead on the West Coast (for tips on using the maps and example applications, see our User’s Guide).
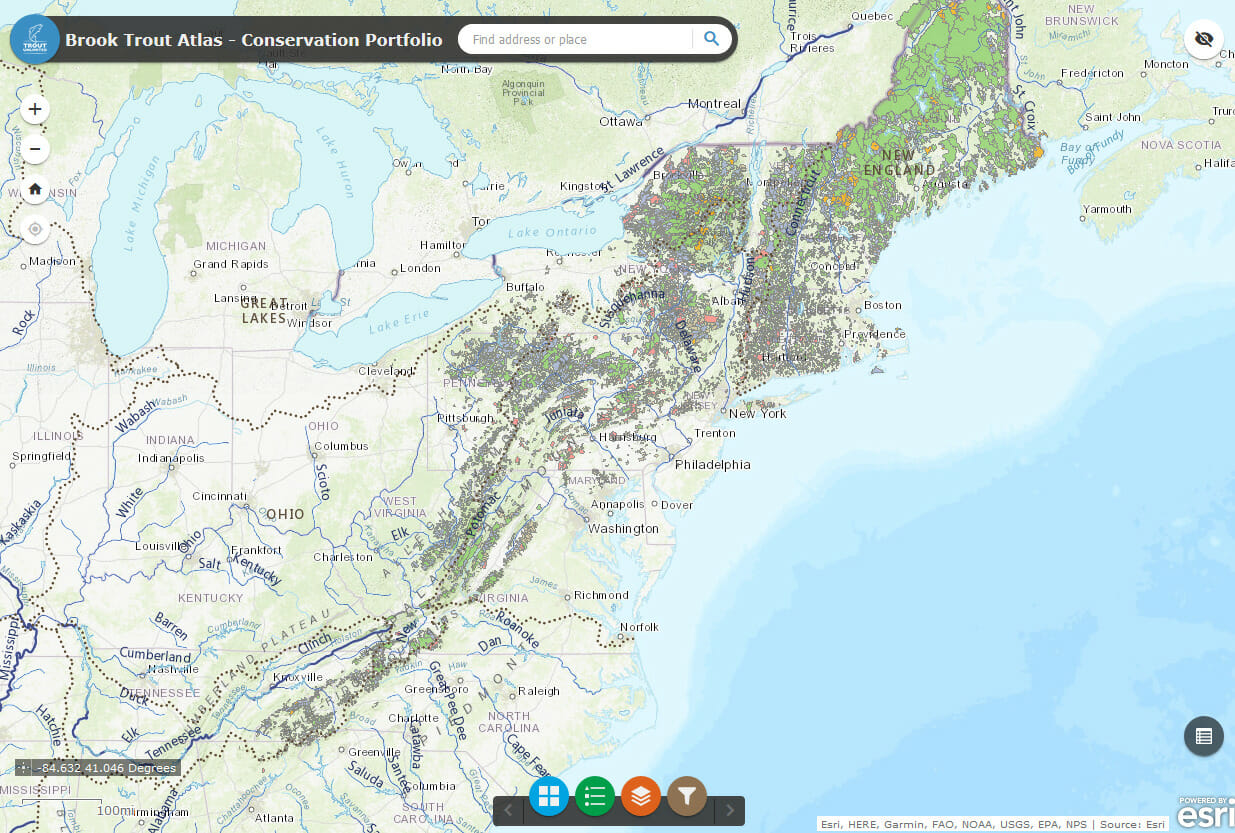
Brook Trout Atlas
The Brook Trout Atlas provides a means to explore mapped data related to brook trout populations, habitats, and threats in local watersheds and across their Eastern range.
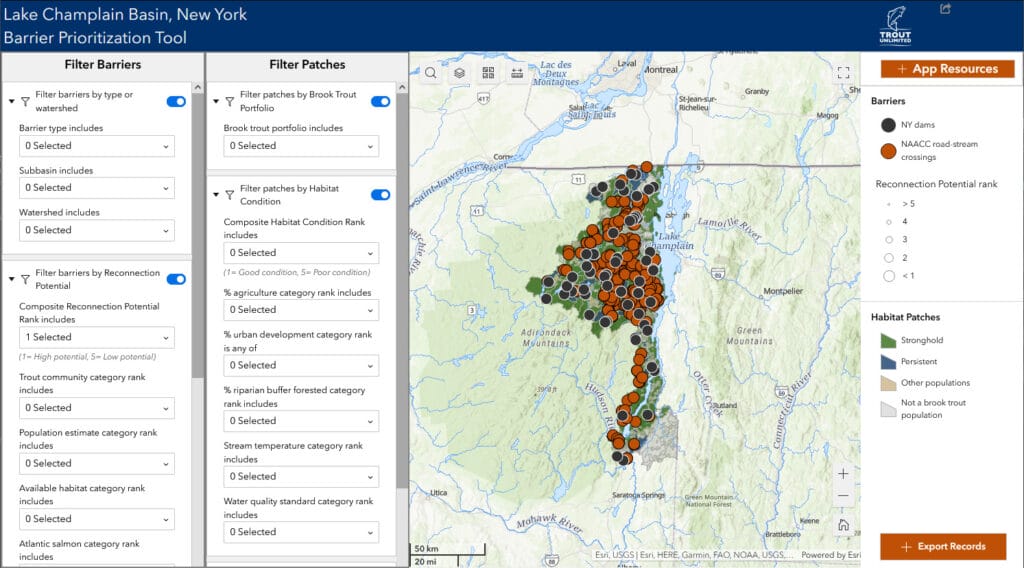
Lake Champlain Basin, New York Barrier Prioritization Tool
This web mapping application is intended to support prioritization of projects to remove or remediate barriers to aquatic organism passage in the New York portion of the Lake Champlain Basin. Dams and road-stream crossings are prioritized according to ecological and community themes, and stakeholders can choose to inspect barrier prioritizations according to their own needs and priorities.
Interconnected patches of trout habitat have also been assessed for Habitat Integrity, Climate Change Resiliency, and native and wild trout population characteristics.
Pipeline Impacts in the Delaware River Basin
We are in the midst of a once-in-a-generation build-out of major interstate pipelines to move natural gas from the Marcellus shale region to markets, other transmission lines, and export terminals on the East Coast. If not properly managed, this construction boom could have major impacts on the streams and forests of the Delaware River Basin states, and the fish and wildlife that live there.
TU works with partners in government agencies, the conservation community, and industry to find ways to avoid, minimize, and mitigate impacts from pipeline construction. For this project, we identified overlapping areas of ecological concern in the Delaware River Basin states. Using GIS datasets, we plotted locations that are critical to the protection of important coldwater fisheries, high water quality, intact lands, and biodiversity, including wild trout streams, waters with special regulatory protections, state Natural Heritage Program sites, and public lands.
We developed an interactive web-based map as a user-friendly tool for anyone who wants to assess the ecological impacts of major pipeline proposals in the Basin, including:
- Industry: To inform and guide route selection during the planning phases of major interstate pipelines.
- Agencies: To evaluate routes, set permit conditions, and assess mitigation needs.
- Conservation professionals: To support science-based discussions when analyzing major pipeline proposals with industry and agencies.